LLM progress in 2025: there was no wall
A year ago I published a list of 7 questions for 2025 about LLMs. The idea was to step back a little from the cycle of lab announcements and the immediacy of social media, and force myself to assess progress using a more stable and objective criterion, one less driven by impressions.
It also seemed like a good way to highlight the aspects that felt most relevant to me at the time, the ones that might offer some clue about the possible future evolution of these technologies.
The first of those seven questions was: have we hit a “wall” in 2025? In other words, has the improvement of LLMs slowed down because of a lack of training data? Have we reached the end of the logarithmic improvement curve? Has scaling stalled?
To answer that question, I am going to focus on three signals, without overcomplicating things:
- size / model families: which commercial and open models the labs publish
- cost: whether getting better results costs much more money
- benchmark results: objective evidence of improvement in model performance
I am writing this at the end of January 2026, with the perspective and data from all of 2025. My conclusion up front: in 2025 there was no wall, but there was an interesting shift in how models are improving.
What the scaling laws predicted
For years, the “official” story of progress in LLMs was fairly simple: if you increase scale, model size + data + compute, performance improves predictably. Not in jumps, but as a smooth curve with diminishing returns: each additional gain costs more than the previous one.
For example, the papers by Jared Kaplan et al. (2020), Scaling Laws for Neural Language Models (OpenAI), and Hoffmann et al. (2022), Training Compute-Optimal Large Language Models (“Chinchilla”, DeepMind), had established the scaling laws for LLM training quite clearly, showing that to obtain similar improvements in new models you need to increase their size by an order of magnitude.
The important idea is this: if you want to maintain a constant pace of improvement, you end up needing enormous increases in scale, of the multiply-by-10 variety, because the marginal gains keep shrinking. A simplified example, based on the scaling laws discussed in those two papers, illustrates the point well:
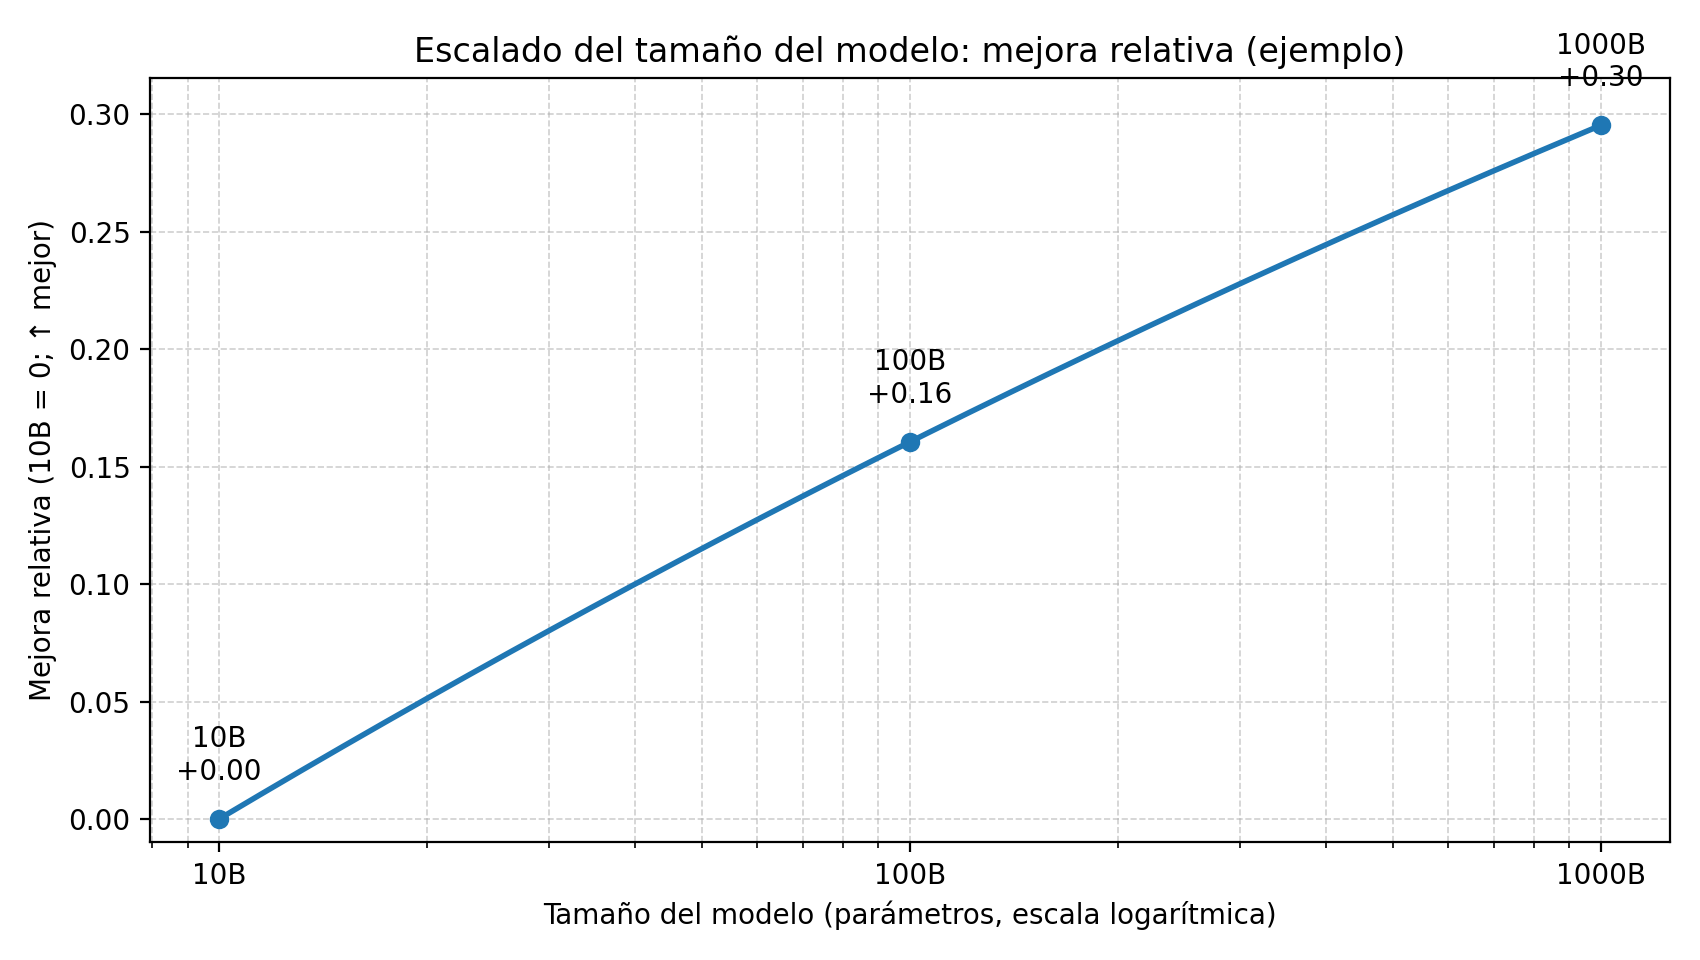 Figure 1. Illustrative example of scaling with a logarithmic X axis, parameters: to obtain similarly sized performance gains, the size of the model must increase by orders of magnitude such as 10B -> 100B -> 1000B.
Clear conclusion: if progress depended mainly on “bigger = better,” then without massive jumps in scale 2025 should have been a year of small and expensive improvements, with a clear flavor of stagnation.
What happened in 2025
And yet that is not what we saw.
During 2025, new versions of the main models kept being released. Companies were immersed in a frantic launch race, often counterprogramming and stepping on one another just to capture attention, as if we were talking about major movie blockbusters. And AI experts and analysts bombarded us with tests, examples, and screenshots showing how well, or how badly, those new models worked. The industry and the fandom did not stop for a second in 2025.
Commercial models
At the end of 2024, the main commercial models in existence were the following. In parentheses I include the output price for 1M tokens, also at the end of 2024.
- OpenAI: o1, GPT-4o ($15.00), GPT-4o mini ($2.00)
- Anthropic: Claude 3 Opus, 3.5 Sonnet ($15.00), 3.5 Haiku ($4.00)
- Google: Gemini 1.5 Pro ($10.00), 2.0 Flash ($0.40)
- xAI: Grok-2 ($10.00), Grok-2 mini
A year later, at the end of 2025:
- OpenAI: GPT-5.2 ($14), GPT-5.2 Pro ($168.00), GPT-5.2-codex ($10.00), GPT-5-mini ($2.00), GPT-5-nano ($0.40)
- Anthropic: Claude 4.5 Opus ($25.00), 4.5 Sonnet ($15.00), 4.5 Haiku ($5.00)
- Google: Gemini 3 Pro ($12.00), 3.0 Flash ($3.00)
- xAI: Grok 4 ($15.00), 4.1 Fast ($0.50)
- Alibaba: Qwen3-Max ($6.00)
Most companies increased the main version number by one step. For example, OpenAI went from GPT-4o to GPT-5.2. Google went from Gemini 2.0 Flash to Gemini 3.0 Flash.
Token prices did not change all that much, although the market became more fragmented, which suggests a more mature and specialized landscape. At the end of 2024 it was easy to distinguish two layers: a high tier at around $10 or $15 per million output tokens and a lower tier around $2 or $4. A year later, those two layers remain, but a new tier has appeared above them, OpenAI’s $168 GPT-5.2 Pro, and another tier of very cheap execution models, the $0.40/$0.50 zone of GPT-5 nano, Grok 4.1 Fast, or Gemini 3.0 Flash.
Capabilities of commercial models
So far we have been talking about inputs, versions, prices, segmentation. To move on to outputs, measured capability, I am going to use an aggregate indicator, a proxy: a summarized measure that condenses several benchmarks into a single number to get a first global reading before we get into specific tests. In particular, I will use the Intelligence Index from Artificial Analysis (AA), an independent platform that publishes its methodology and, crucially, runs the evaluations itself, instead of relying on self-reported numbers from the labs.
If you are interested in the kitchen behind these numbers, here is an interview, Latent Space, with George Cameron and Micah Hill-Smith, the creators of Artificial Analysis. They explain why they run the evaluations themselves, standardizing prompts, avoiding cherry-picking, and controlling endpoints, their “mystery shopper” policy, and how they build the Intelligence Index v3/v4 by aggregating benchmark sets with repetitions to estimate stability.
https://www.youtube.com/watch?v=v5mBjeX4TJ8
The Intelligence Index v4.0 aggregates 10 evaluations and returns a 0-100 score. The figure below shows an explicit comparison between December 2025 and December 2024 using the models mentioned above, and it shows a clear upward shift: the frontier moves from 31, o1, to 51, GPT-5.2, and the leading group moves upward as a whole.
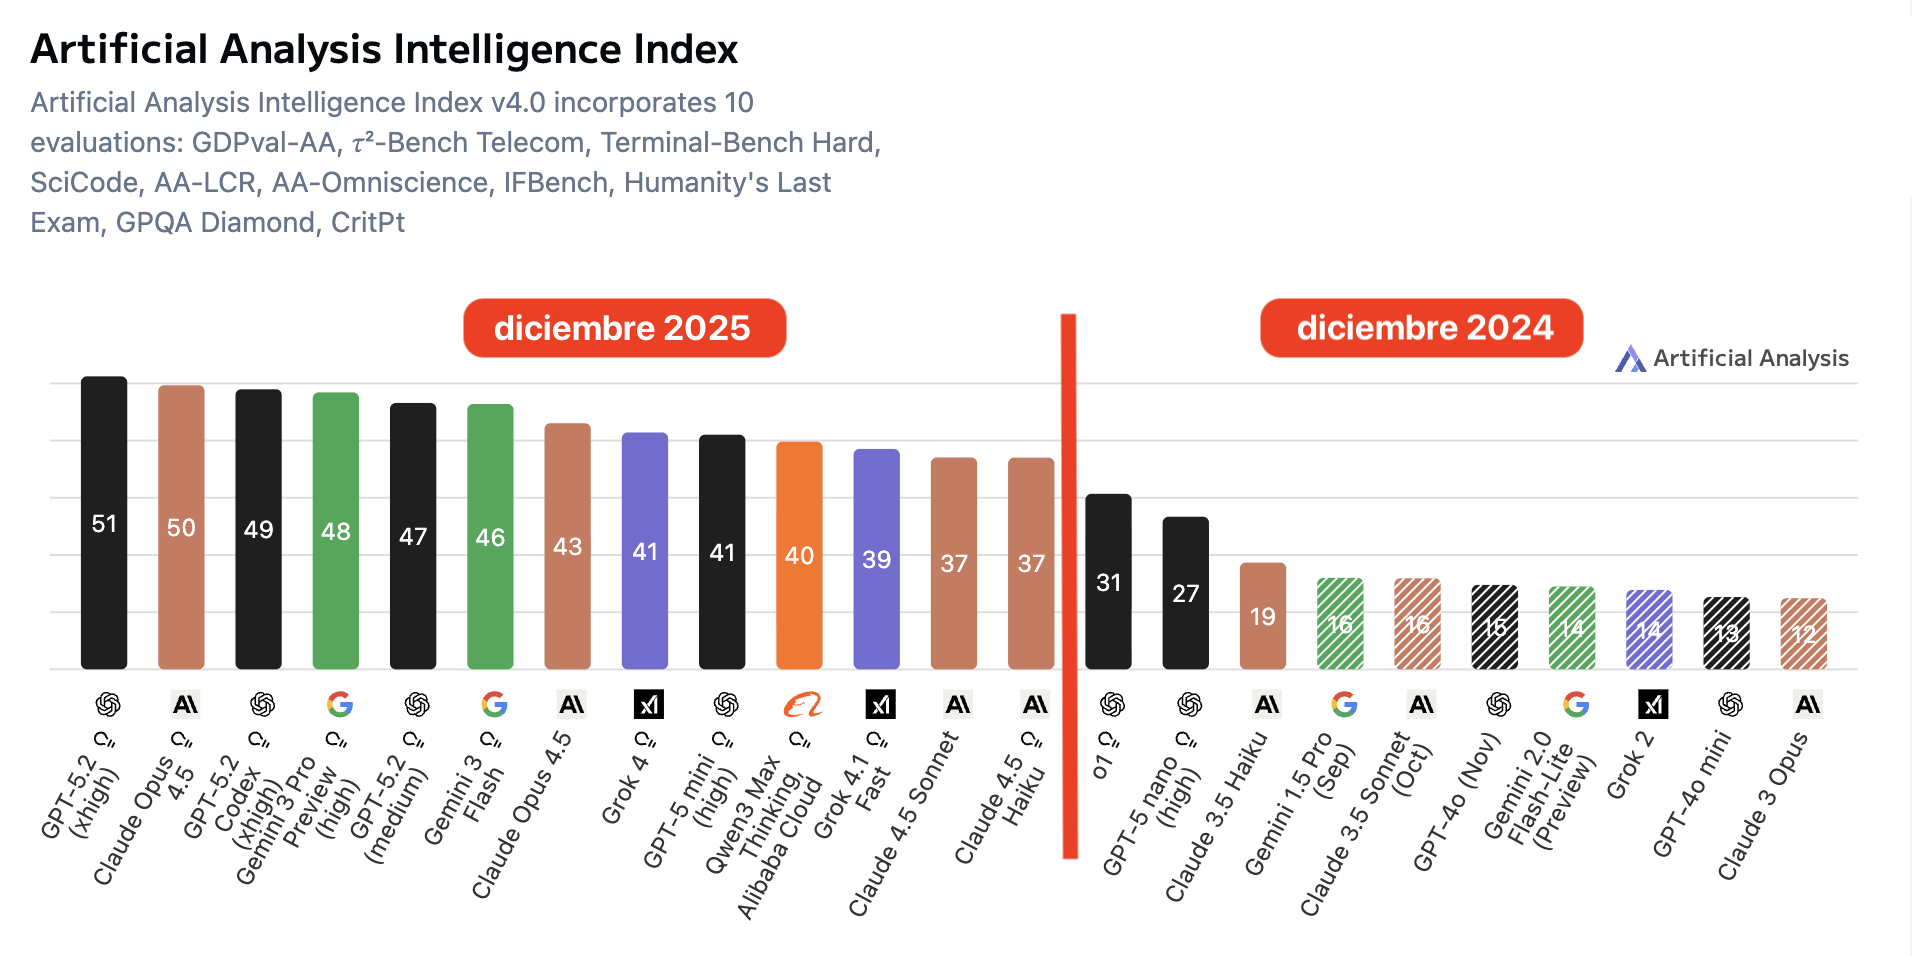 Figure caption: Artificial Analysis Intelligence Index (v4.0): comparison of scores for prominent commercial models in December 2024 and December 2025. The index summarizes results from 10 benchmarks on a 0-100 scale; the measured capability shifts upward clearly, from a best score of about 31 to about 51, and the leading group rises consistently.
Open models
And what happened with open models? Unlike commercial models, in their case we can analyze how their parameter counts changed during 2025.
It is worth noting that in 2025 MoE, mixture-of-experts, architectures became widespread. They allow only a small subset of the model’s parameters to be activated, so compute per token stays relatively low even when the total number of model parameters is much larger. The numbers shown in parentheses below are the approximate total parameter counts, the ones used during training and the ones that determine the model’s capacity.
At the end of 2024:
- Alibaba: Qwen 2.5 (72B)
- Mistral: Mistral Large 2.1 (123B)
- NVIDIA: Nemotron-4 (340B)
- Meta: Llama 3.1 (405B)
- DeepSeek: DeepSeek-V3 (671B)
And the main open source models at the end of 2025:
- OpenAI: gpt-oss (120B)
- Alibaba: Qwen3 (235B)
- xAI: Grok-1 (314B)
- NVIDIA: Nemotron 3 (Nano 30B, Super 100B, Ultra 500B)
- Mistral: Large 3 (675B)
- DeepSeek: DeepSeek R1, DeepSeek-V3.1 (671B)
- Moonshot AI: Kimi K2 (~1T)
- Zhipu AI: GLM-4.5 (130B)
If we read this at a coarse level, in one year there is no order-of-magnitude jump in size. At the end of 2024, frontier open models averaged around ~300B parameters; by the end of 2025 they are around ~450B, approximately a 1.5x increase, about 50% more.
Capabilities of open models
The interesting part is that, even without a 10x jump in parameters, the measured capability of the best open models does shift upward clearly. Using the same Artificial Analysis Intelligence Index v4.0, the same aggregate over 10 evaluations, the maximum goes from 16, Qwen2.5 Max, and 15, Mistral Large 2, to 42, DeepSeek V3.2, and 41, Kimi K2 Thinking. In other words, a jump of ~+24 points in one year, with a group of open models already above 20-30 on the scale.
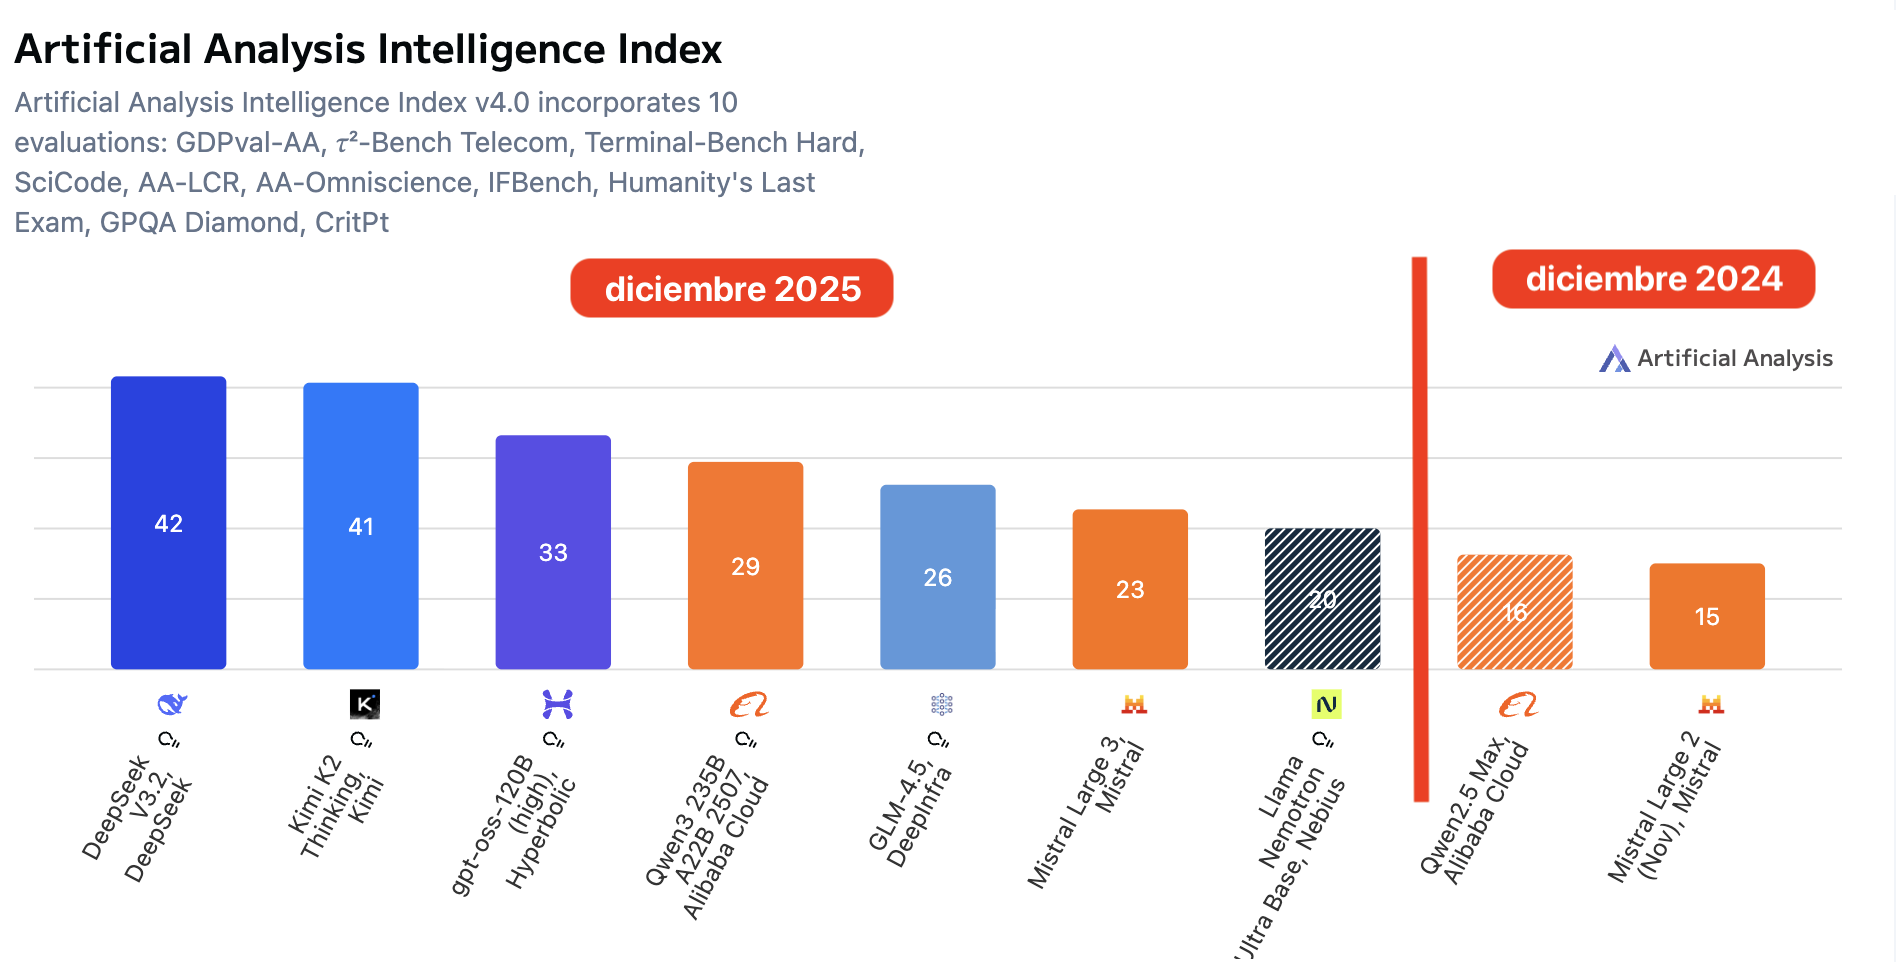
Figure caption. Artificial Analysis Intelligence Index (v4.0) — open-weight models: comparison of December 2024 vs December 2025. The index aggregates 10 benchmarks on a 0-100 scale; the open-weights frontier rises from ~18 to ~42, and several models appear in the 20-30+ range, indicating a substantial shift in capability without requiring a 10x increase in size.
How much did scale grow in 2025?
We have seen that measured capability rises. Before going into specific benchmarks, it is worth looking at the basic variable we discussed at the beginning: how much did model scale, that is, size, grow in a single year? In open models it can be estimated; in commercial ones, it can only be bounded through indirect signals.
Open models: modest size growth
How much did model size increase in a year? In open models, as we have already seen, not that much. At the end of 2024 frontier open models were around ~400B parameters, and at the end of 2025 around ~600B, about 1.5x. That is nowhere near the 10x that power-law reasoning would suggest is needed to maintain the previous pace of improvement.
Commercial models: lack of data and reasonable estimates
As for commercial models, there is no direct way to know, because labs stopped publishing that figure in their system cards a long time ago. Some leaks spoke of ~1.8T, 1,800B, for GPT-4o, roughly 10x GPT-3’s parameter count in 2020, 175B. A reasonable speculation is to speak of something on the order of ~1T, 1,000B, one trillion in the US scale, for frontier commercial models at the end of 2024.
And at the end of 2025? We can only speculate. We can start from statements by Elon Musk himself saying that Grok 4 has 3T parameters. That would put us around ~3x the size of the models from a year earlier, compatible with the pace seen in open models, about 2x, but still very far from the 10x suggested by the power laws.
Inference: token cost, MoE, and “effective size”
Token prices are related to inference cost, which in turn should be related to the size of the models at execution time. Given that most models use Mixture-of-Experts, MoE, and that the ratio of active parameters to total parameters is usually between ~2x and ~4x, then if inference costs at the end of 2025 are similar to those from a year earlier, we are talking about models with a total size between ~2x and ~4x the size of models from the end of 2024. That fits with the 3T-parameter figure Musk mentions.
As a conclusion from all the evidence presented so far, 2025 does not look like a 10x-in-scale year. And yet AA’s Intelligence Index suggests that aggregate capabilities continued to increase substantially. The natural question is whether that signal still holds when we move down to specific tasks, instead of an aggregate index. Let us check it using two benchmarks where the 2024 -> 2025 jump is especially clear: ARC-AGI and SWE-bench.
ARC-AGI and SWE-bench
ARC-AGI
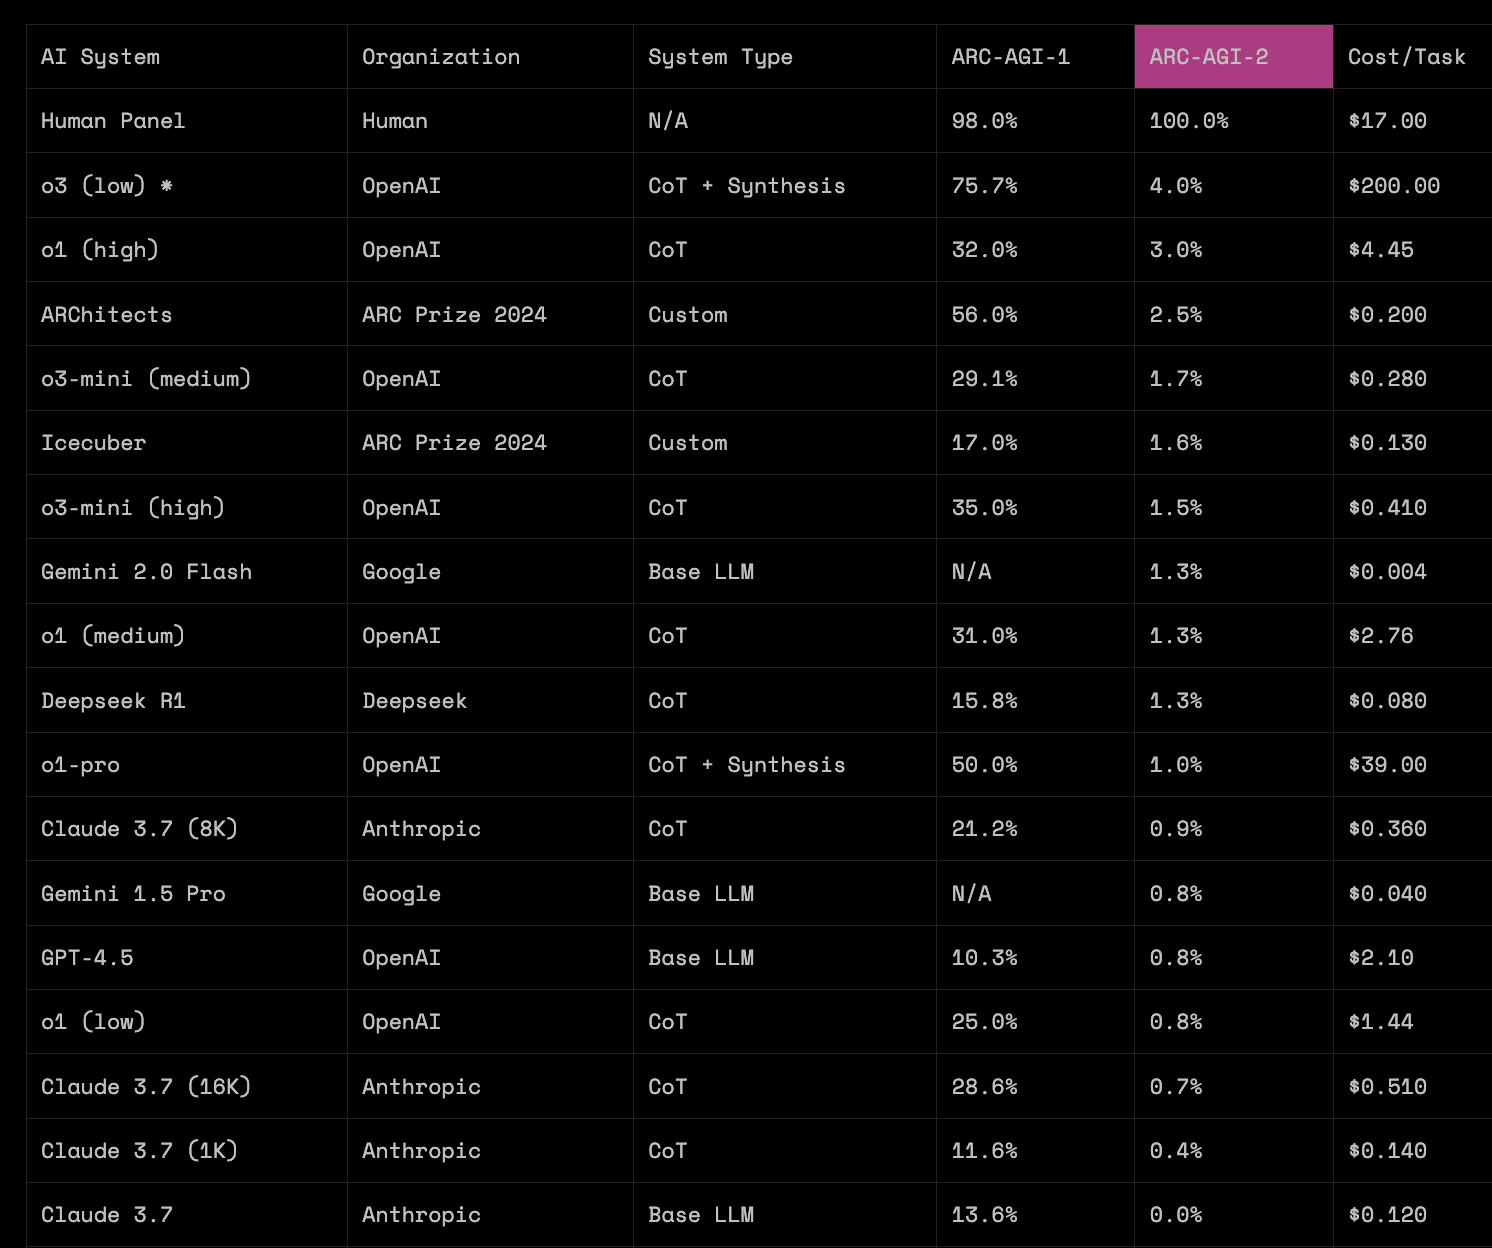
Let us begin with ARC-AGI, the test proposed by François Chollet that we have already discussed in this newsletter, in which the system must infer rules and patterns from colored grids. ARC publishes results for two variants, ARC-AGI-1 and ARC-AGI-2, the latter being substantially more demanding.
Snapshot, March 2025. In the leaderboard from 03/24/2025, recovered through archive.is, we can see that among widely deployed models with reasonable costs, most of them sit around ~30% or less on ARC-AGI-1. On that date an experimental OpenAI system also appears, o3 (low), with 75.7% on ARC-AGI-1 but at a cost of $200 per task, while the most capable public model in the table, o1 (high), scores 32.0% on ARC-AGI-1 and 3.0% on ARC-AGI-2 at a cost of $4.45 per task.
Snapshot, January 2026 / end of 2025. A year later, the situation has changed substantially. In the current table, several frontier models sit in the upper range of ARC-AGI-1, and cost per task has fallen by orders of magnitude. For example, GPT-5.2 (Medium) obtains 72.7% on ARC-AGI-1 for $0.759 per task: performance comparable to o3 (low) in 2025, but at a cost about 263x lower.
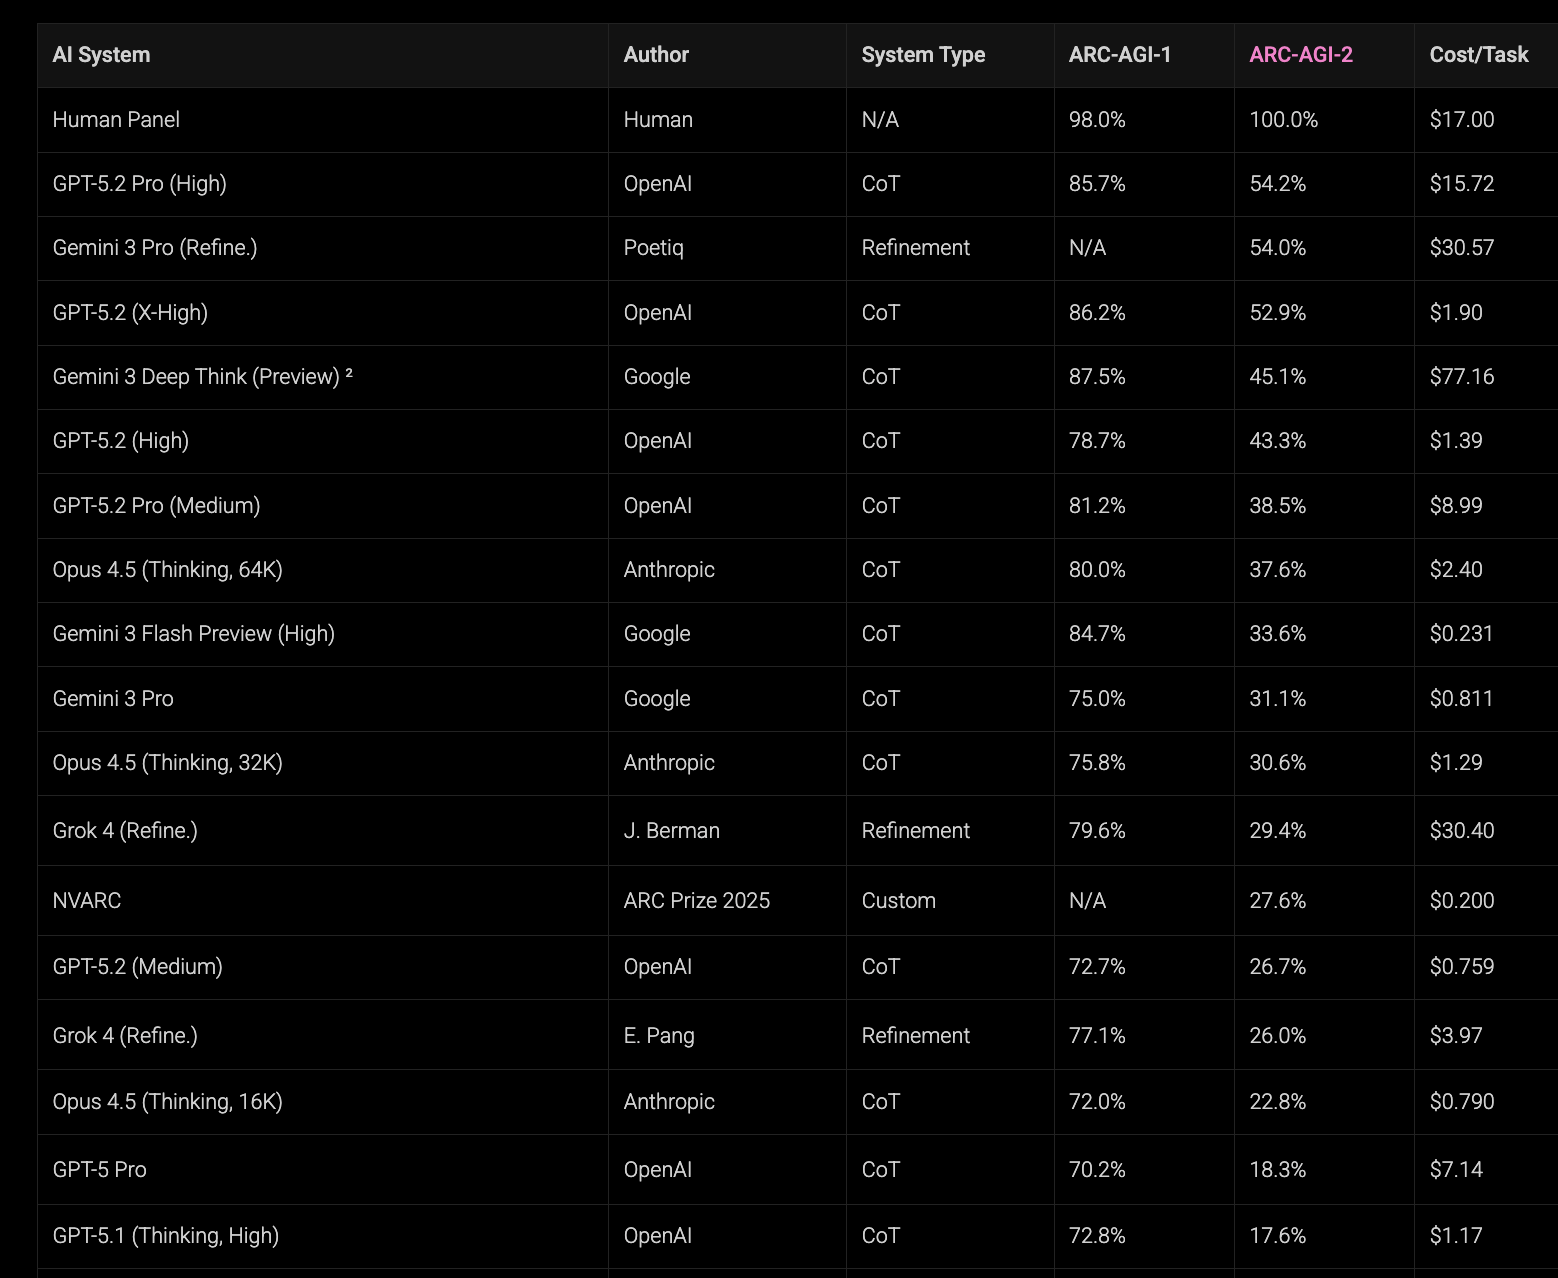
On ARC-AGI-2 the jump is even clearer: o3 (low) appears with 4.0% in 2025, while in the recent table GPT-5.2 Pro (High) reaches 54.2% at a cost of $15.72 per task.
If we fix a budget per task on the order of $1-$2, the change is also easy to see: in 2025 that zone was associated with results around ~25% on ARC-AGI-1, whereas in 2026 we see results around ~70-80% at similar costs.
The ARC organization presents current ARC-AGI-1 and ARC-AGI-2 results in a visually brilliant way that lets us inspect the performance-cost tradeoff at a glance and identify efficient frontiers, that is, which models dominate for a given budget. To verify the progress made in the last year, we can play a simple game: find the positions of late-2024 models, GPT-4.5 or Claude 3.7, in those figures and compare them with current frontier models at the same price point, moving upward vertically.
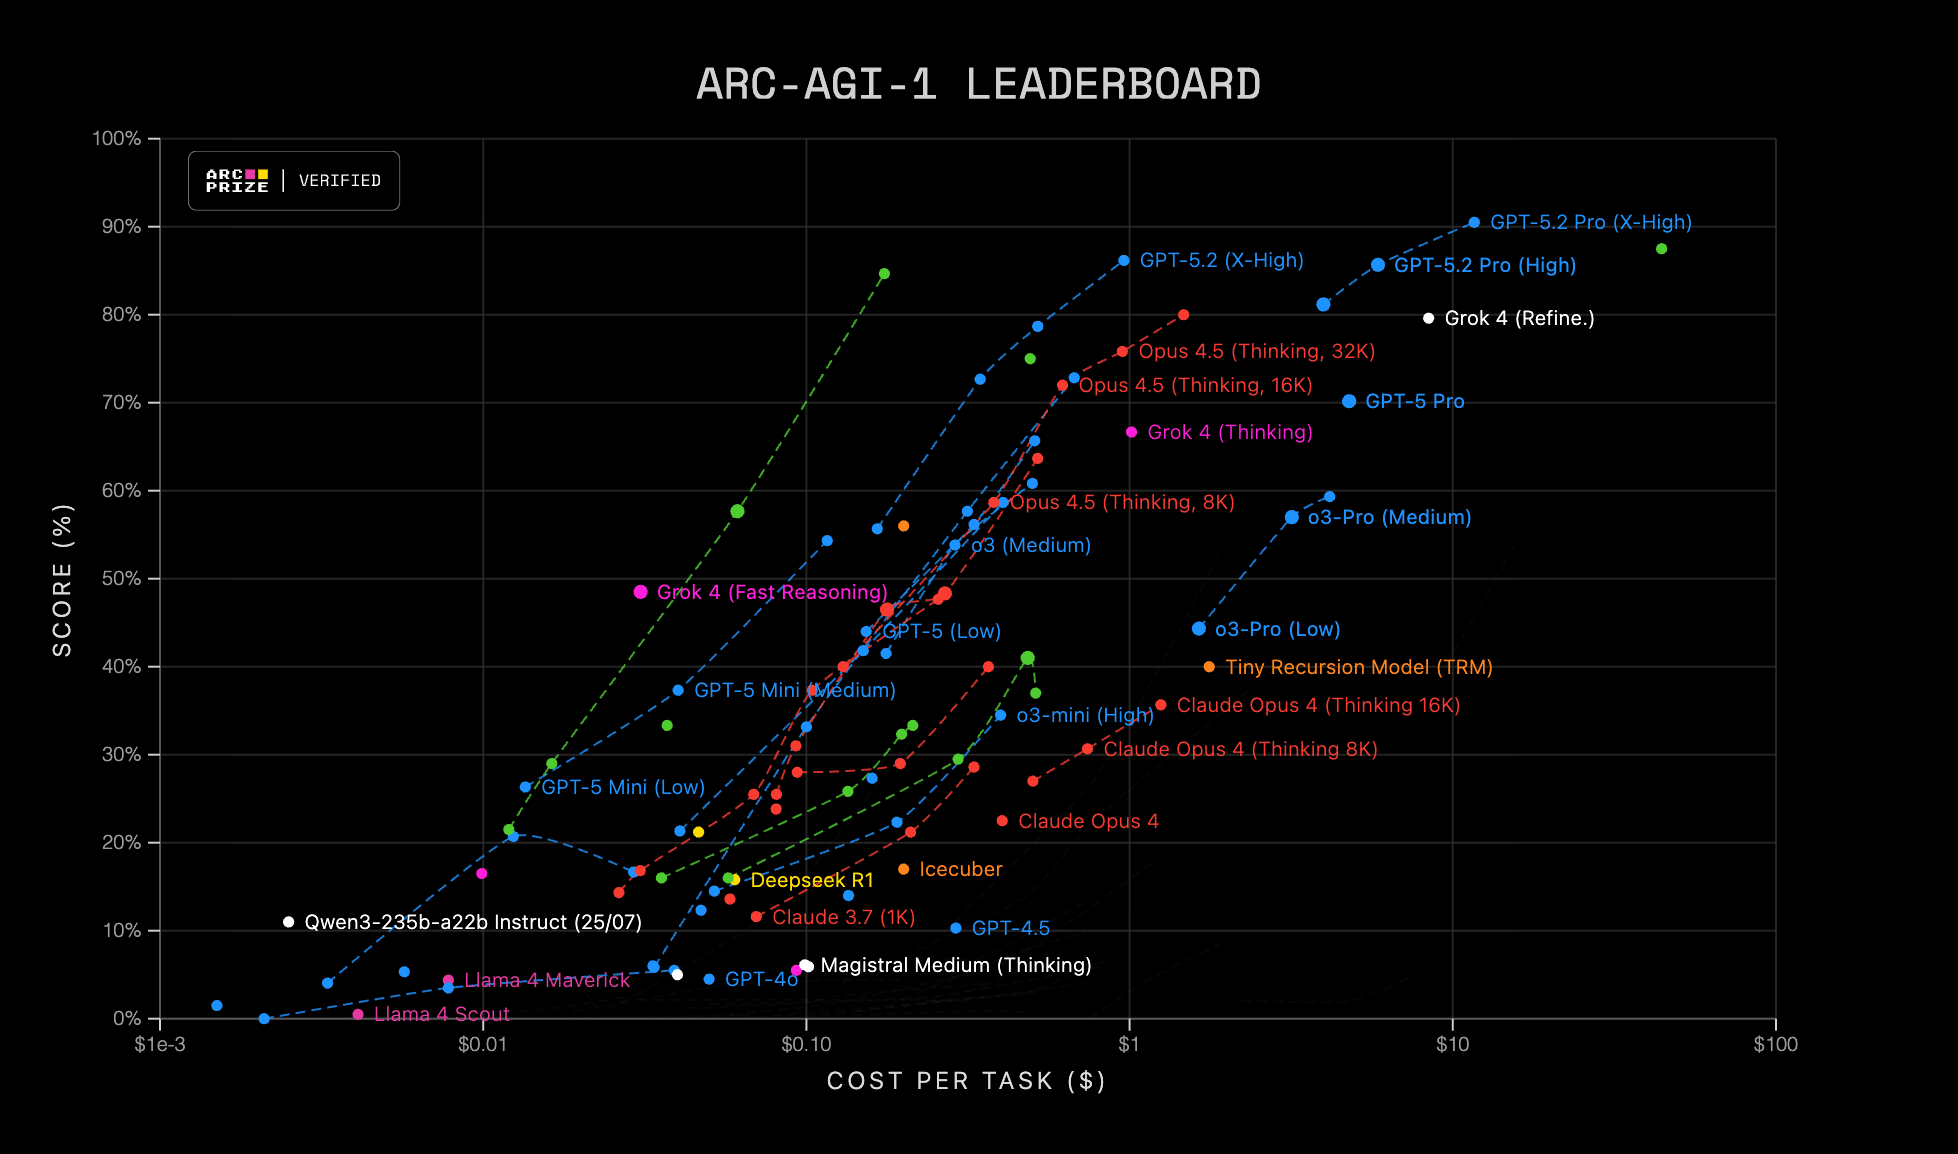
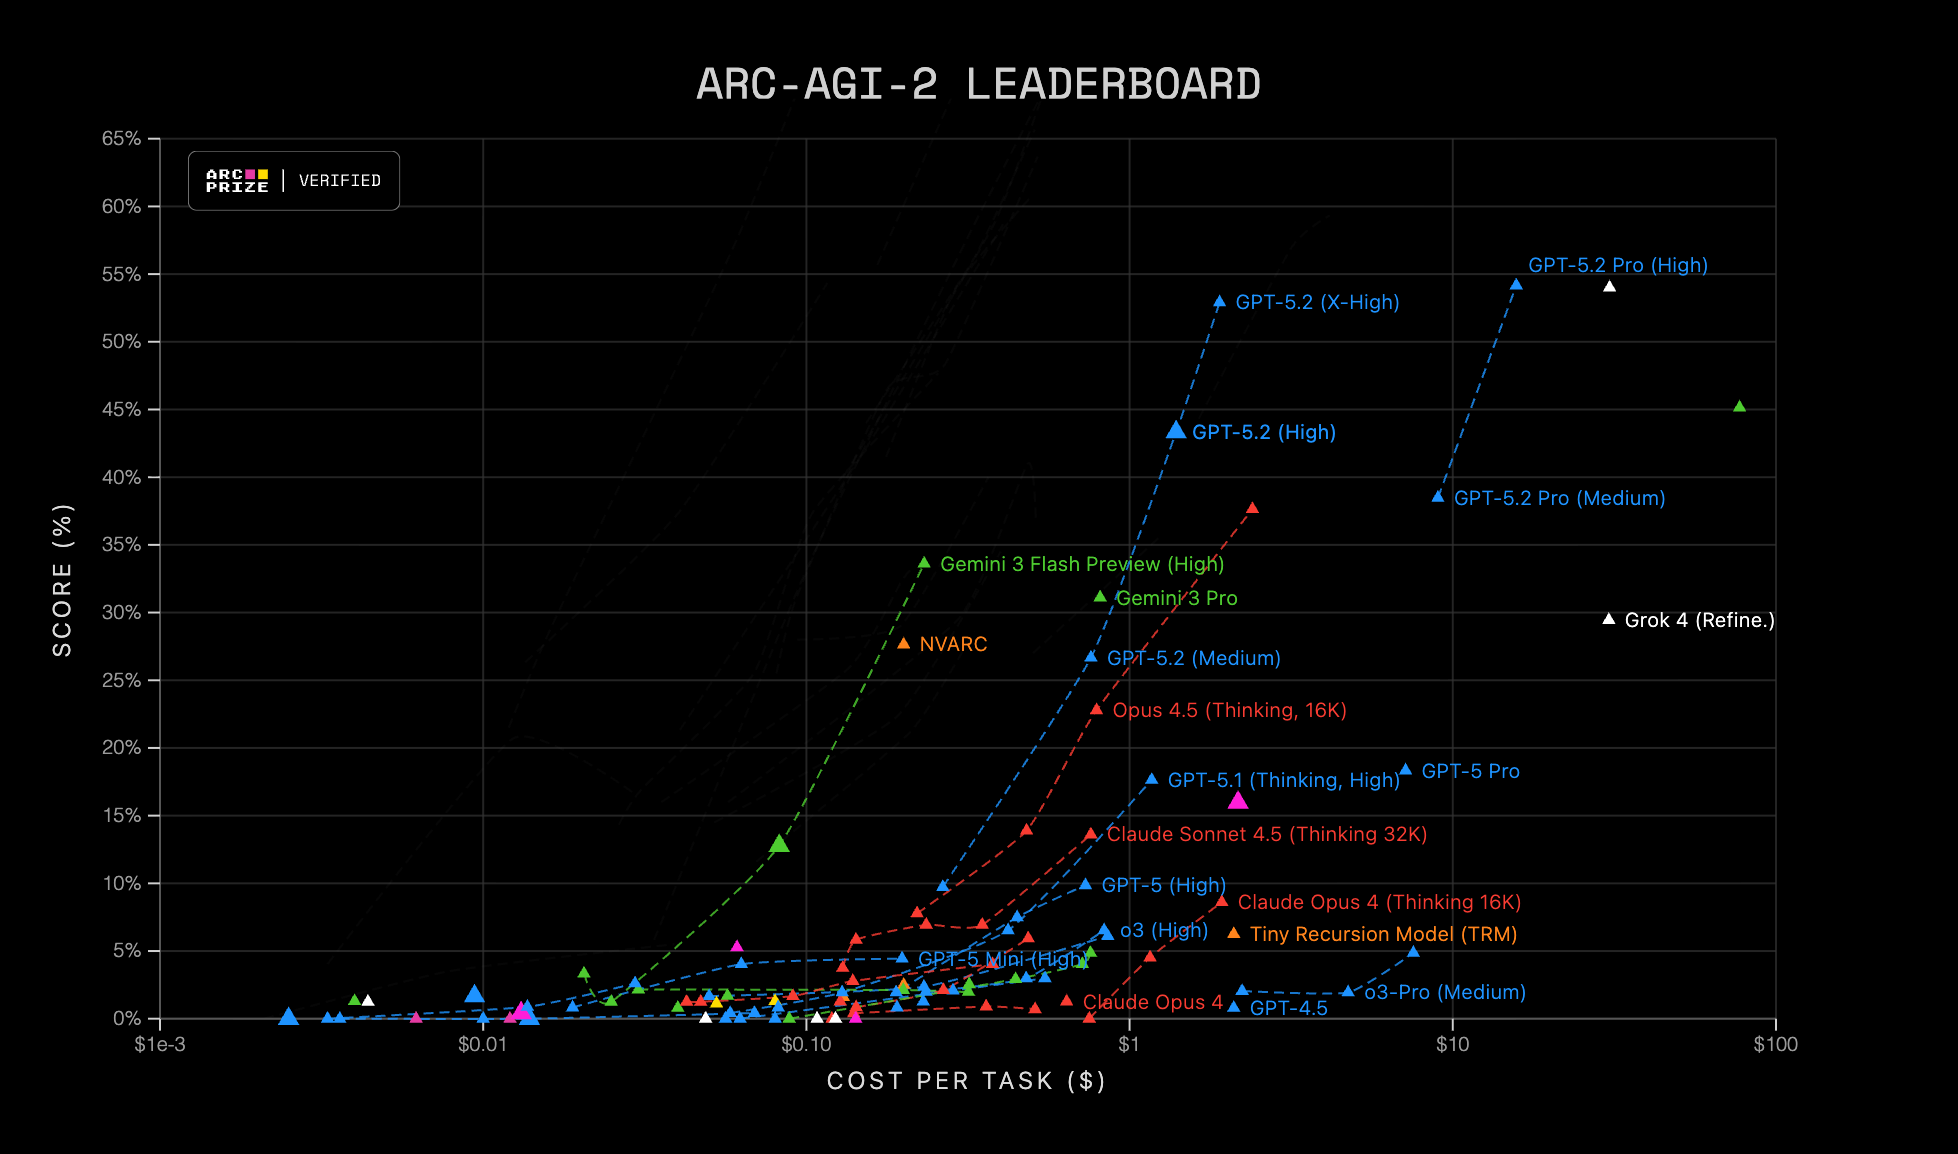 Figure caption, ARC-AGI Leaderboard: scatter plot of score (%) versus cost per task (USD) on a logarithmic scale. Each point represents an evaluated configuration, a model and mode/settings, and the dashed lines group related variants. ARC-AGI-1 on the left and ARC-AGI-2 on the right.
SWE-bench Verified
The benchmark SWE-bench Verified is also highly relevant, and it measures something quite different from ARC-AGI: not rule induction in grids, but software engineering capability. The dataset is made up of real tasks extracted from popular Python repositories. Each example includes a bug to fix and a battery of tests. The model’s goal is to propose a patch that makes the tests pass again. It is not an abstract code-completion exercise: it forces the model to read and understand an existing codebase, locate the cause of the failure, modify the right files, and respect conventions, dependencies, and side effects.
It is also a test that is not saturated. At the end of 2024, the best public scores were around 50%, usually obtained using agents and relatively complex orchestration layers, scaffolds, based mainly on Claude 3.5 Sonnet.
By the end of 2025 we enter the 70-75% range. And, more importantly, that success rate is achieved with a minimal-scaffold setup: mini-SWE-agent, around 100 lines of Python, which essentially implements a loop for interaction with the LLM and the execution of actions. That reduces the weight of external orchestration and brings the evaluation closer to what matters here: comparing model capability with a simple and standardizable scaffold, in contrast with 2024, when a non-negligible part of performance depended on more elaborate agents.
The following figure shows the ranking of the best-performing models on SWE-bench Verified at the moment of the screenshot. Anthropic, Google, and OpenAI lead the ranking with resolution rates above 70%.
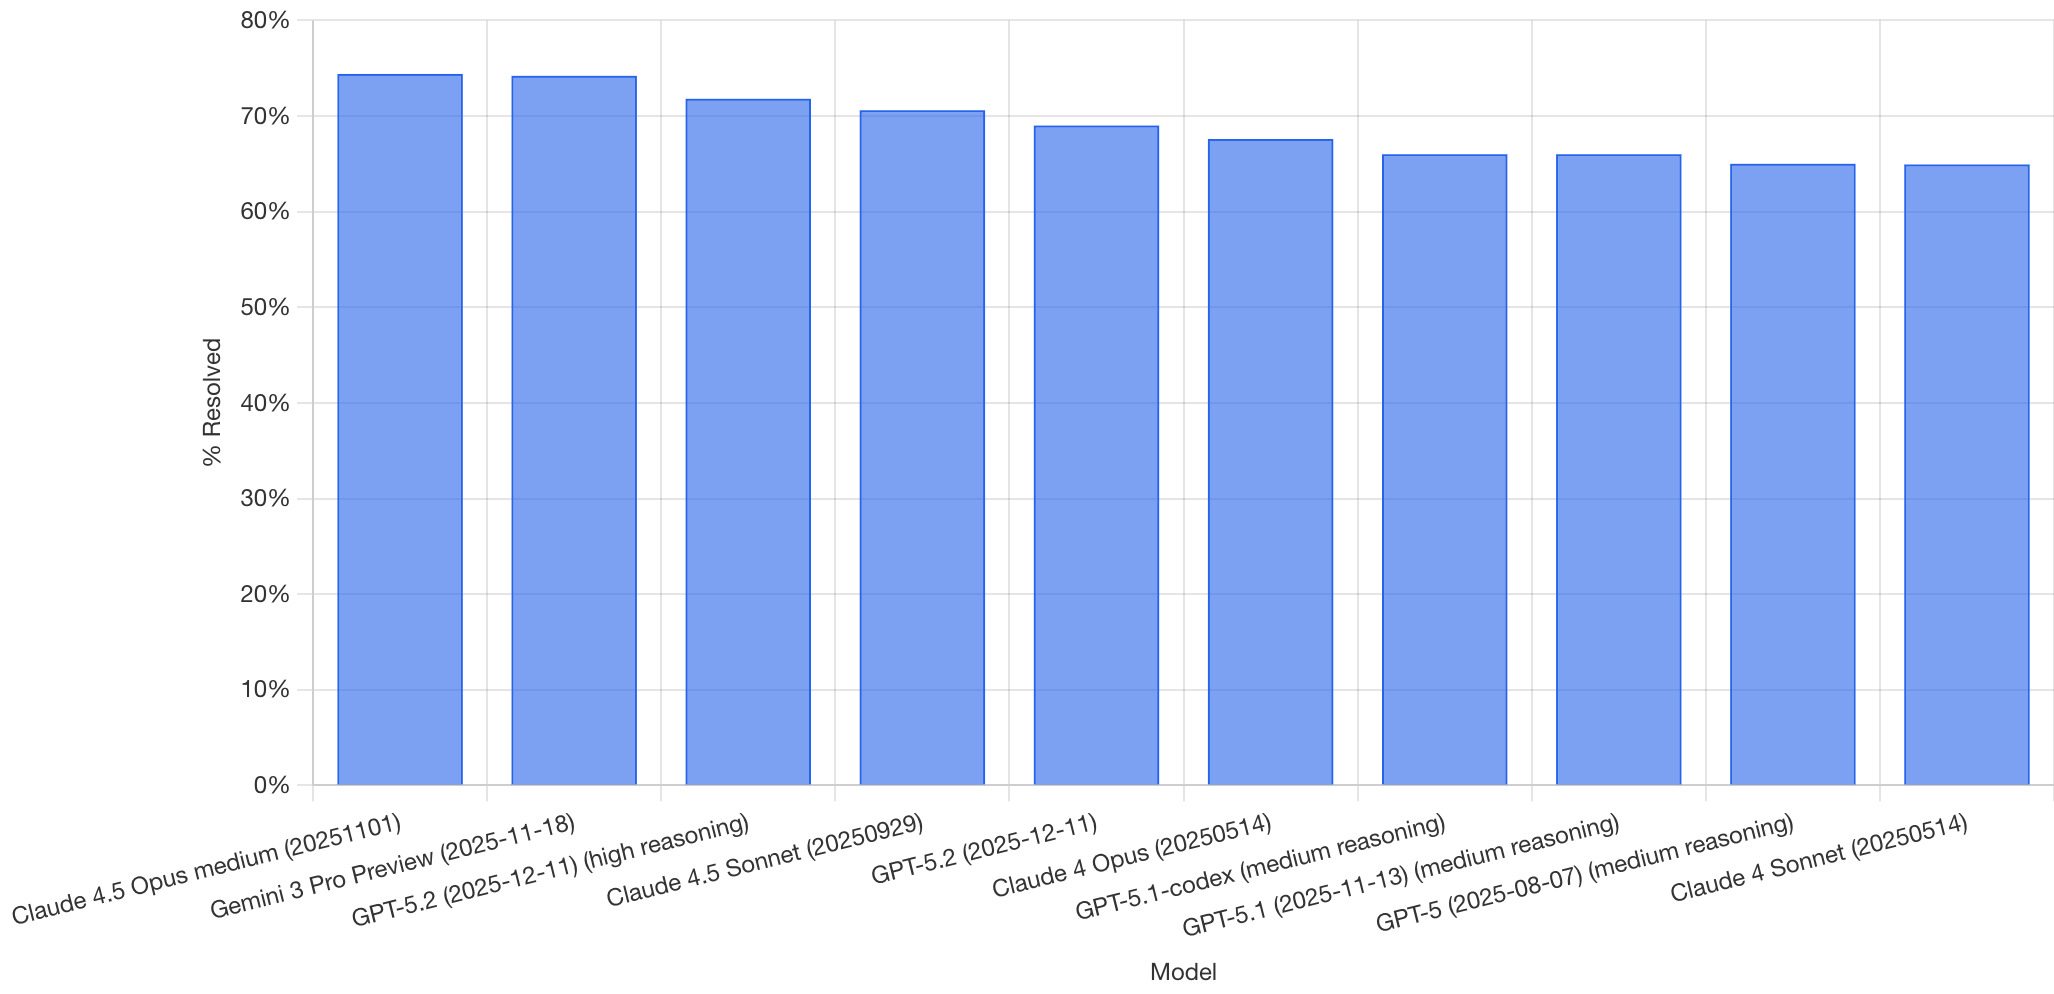
Figure caption. SWE-bench Verified: percentage of tasks solved, % Resolved, by model. Each bar corresponds to an evaluated variant, the X axis includes the model name and the date/version reported in the capture.
Ofir Press, one of the creators of SWE-bench, predicts that by the end of 2026 the benchmark will reach 86% accuracy, in the configuration “SWE-bench Verified w/ mini-SWE-agent.”
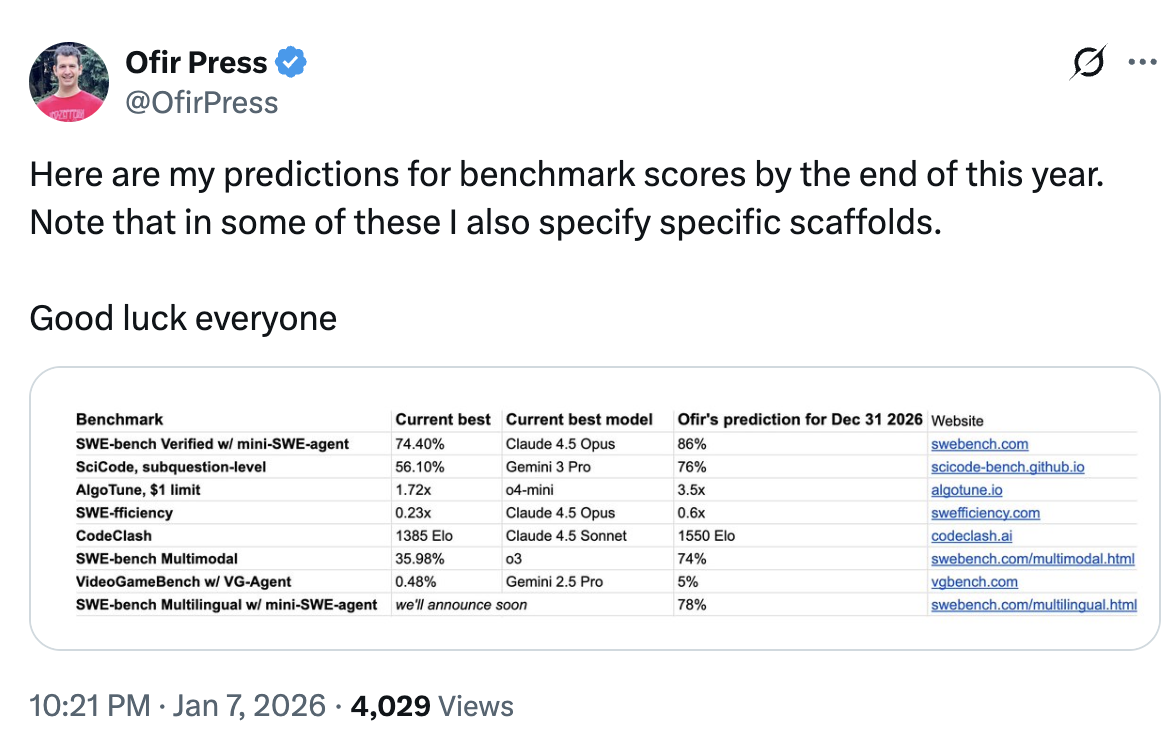
Figure caption. Screenshot of Ofir Press’s prediction, January 2026, with a table of “current best result” and “prediction for Dec 31, 2026”; in the first row it shows SWE-bench Verified w/ mini-SWE-agent: 74.40% -> 86%.
What drove the jump in capability in 2025?
In 2025, substantial improvements were observed in models without a proportional increase in their size or in per-token inference cost. The number of parameters seems to have grown, in many cases roughly doubling or tripling, but not by ~10x, which is what a simplified reading of the scaling laws would suggest if we wanted to maintain a “linear” pace of improvement.
One reason why there may not have been a large and generalized increase in model size is the limited availability of new hardware during much of the year. We know that many 2024 models were trained mainly with Hopper GPUs, especially H100. For example, Llama 3.1, 405B, released at the end of July 2024, was trained at a scale of >16K H100s for several months. The Blackwell platform, B200/GB200, only began its deployment ramp from the second quarter of 2025 onward and requires significant infrastructure changes, so it is reasonable to assume that a significant fraction of the 2025 training cycle still depended on Hopper.
And yet performance kept rising. Labs published new versions, and benchmarks improved clearly. In particular, ARC-AGI-1 can now be considered solved, and SWE-bench Verified rises from values around 50%, with complex scaffolds, to the ~70-75% range with minimal scaffolding.
How do you get that much improvement with only moderate scale increases?
(1) Inference optimization and efficiency. In 2025 capabilities were squeezed harder through inference improvements: token-usage strategies, adaptive budgets, and more efficient configurations. In addition, distillation techniques were used to transfer capability into smaller models, reducing cost without sacrificing too much performance.
(2) More efficient architectures, MoE. The use of Mixture-of-Experts (MoE) makes it possible to increase total parameter count without increasing compute per token proportionally, by activating only a fraction of the model at each step. That makes it easier to improve performance while keeping operational cost under control.
(3) Explicit reasoning, Chain-of-Thought, and control of test-time compute. The most visible advance of 2025 was the generalization of “reasoning” models based on Chain-of-Thought (CoT). OpenAI popularized it with o1, at the end of 2024, and soon after DeepSeek published an open implementation. By the end of 2025, practically every lab offers reasoning variants. The technical consequence is important: observable capability no longer depends only on the model’s “immediate answer,” a kind of System 1, but also on the test-time compute invested in a reasoning trace, System 2: planning, step verification, correction, and retries.
(4) Agents and tools: learning policies for tool use. CoT was also a key component for agents that use tools in a controlled way, search, code execution, file manipulation. For this to work, the model has to learn when to use a tool, how to formulate the call, and how to incorporate the result into its plan.
(5) Post-training with large-scale reinforcement learning, RL. To refine capabilities beyond pre-training, 2025 consolidates the use of RL in post-training. OpenAI popularized RLHF, reinforcement learning from human feedback, but human feedback limits scale and the length of trajectories. In 2025, schemes become widespread in which the reinforcement signal comes from automatic verifiers, in tasks with checkable solutions, and from LLMs as judges in tasks that are not trivially verifiable. This allows longer trajectories and more extensive training of System 2 skills: planning, verification, and tool use.
The result of 2025 is that progress is no longer governed exclusively by “bigger = better.” With moderate scale increases, the combination of efficiency, inference and architectures, explicit reasoning, agents, and RL-based post-training is enough to produce large and measurable improvements.
Scaling and innovation: the 2025 pattern
In 2025 there are no signs of a “wall.” What we observe is that scaling remains important, but it no longer acts alone: progress comes from combining scaling with techniques that increase effective capability per unit of compute, both in training and in inference.
In Demis Hassabis’s words, speaking about DeepMind’s recent advances:
That combination [of innovation and scaling], I think, allows us to be at the frontier of both innovation and scaling. In practice, you can think that approximately 50% of our effort is in scaling and the other 50% in innovation. And my bet is that you are going to need both to get to AGI.
If 2024 was the year in which the idea that “reasoning costs tokens” became established, 2025 is the year in which the industry learned how to convert that cost into measurable performance: better inference policies, better architectures, and more systematic post-training. Scaling does not disappear, but to explain the jump of 2025, we also need to look at innovation.